


Page 16 - Demo
P. 16
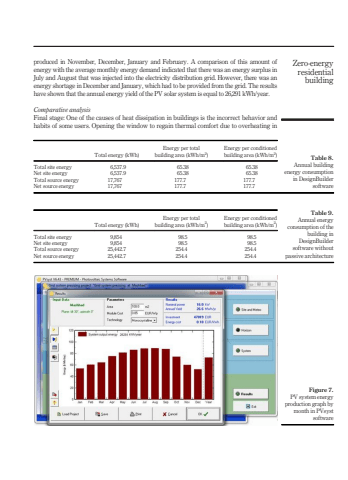
produced in November, December, January and February. A comparison of this amount ofenergy with the average monthly energy demand indicated that there was an energy surplus inJuly and August that was injected into the electricity distribution grid. However, there was anenergy shortage in December and January, which had to be provided from the grid. The resultshave shown that the annual energy yield of the PV solar system is equal to 26,291 kWh/year.Comparative analysisFinal stage: One of the causes of heat dissipation in buildings is the incorrect behavior andhabits of some users. Opening the window to regain thermal comfort due to overheating inTable 8.Annual buildingenergy consumptionin DesignBuildersoftwareTotal energy (kWh)Energy per totalbuilding area (kWh/m2)Energy per conditionedbuilding area (kWh/m2)Total site energy 6,537.9 65.38 65.38Net site energy 6,537.9 65.38 65.38Total source energy 17,767 177.7 177.7Net source energy 17,767 177.7 177.7Table 9.Annual energyconsumption of thebuilding inDesignBuildersoftware withoutpassive architectureTotal energy (kWh)Energy per totalbuilding area (kWh/m2)Energy per conditionedbuilding area (kWh/m2)Total site energy 9,854 98.5 98.5Net site energy 9,854 98.5 98.5Total source energy 25,442.7 254.4 254.4Net source energy 25,442.7 254.4 254.4Figure 7.PV system energyproduction graph bymonth in PVsystsoftwareZero-energyresidentialbuilding


